In today's increasingly data-driven world, it's more important than ever to have accessible ways to view and understand data and leverage it to make informed business decisions. Business analytics and data visualization provide insights into how things have historically played out, possibilities for new scenarios, and much more.
It's no surprise businesses today have gravitated toward wanting to understand and leverage data visualization capabilities as an efficient way to help make sense of business-critical information and large sets of complex data at scale. Across all industries, business leaders today understand the importance of data and how to use it to its fullest potential – with the help of analytic dashboards and data visualization tools.
In this post, we're breaking down analytics dashboards, data visualization, what each is, their advantages, and how they can impact your business in significant ways. Let's dive in!
Why is data visualization important?

Business intelligence aims to collect and turn data into actionable information that fulfills operational and strategic objectives and supports a person's decision-making. Why is it important? Because it helps people see, interact with, and better understand their organization's data. Whether simple or complex, effective visualization and BI tools can bring everyone together on the same page, regardless of their expertise with data or daily interaction with these numbers.
Not only is the actual data necessary, but the ways BI display them are just as crucial. According to MIT, 90% of information transmitted to the brain is visual. This means that the better we can represent complex numbers like big data, the easier it becomes for all stakeholders and employees to understand. Data visualization ultimately helps provide more people who use BI tools and analytics solutions with a familiar, engaging, interactive way to absorb information at a glance and understand the insights hidden beneath the numbers.
These data visualization tools and processes provide a quick and effective way to communicate and share information in an easy-to-read manner using visual information.
See data visualization services offered by WCI >>>
What is a data visualization dashboard?
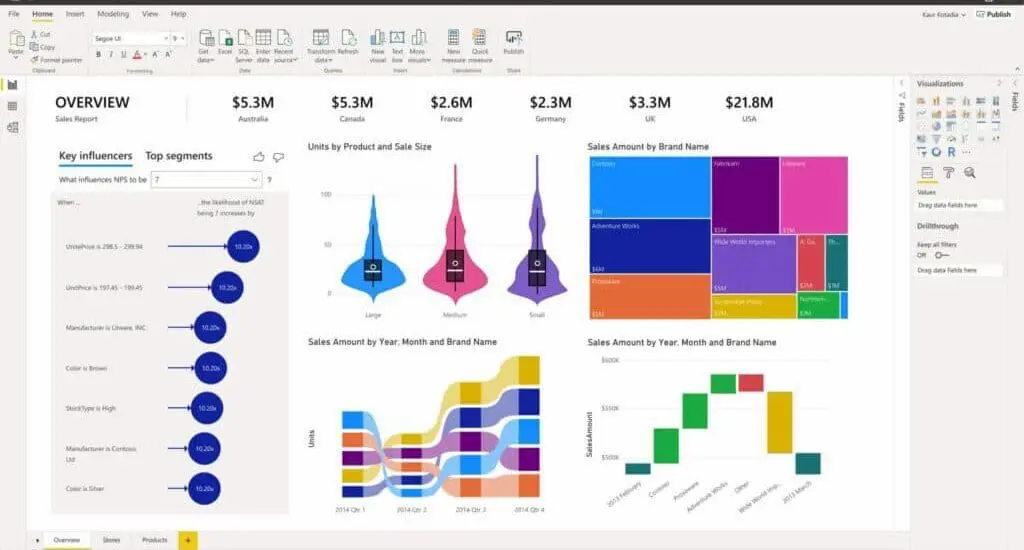
Data visualization, also known as data exploration or Business Intelligence (BI), is often referred to as dashboarding. The data visualization industry has garnered much attention over recent years because of the easy-to-understand format in which complex data is delivered. Dashboards, in turn, present this complex data in an easy-to-interpret format.
These dashboards allow those viewing them to easily track, analyze, and display KPIs, metrics, and critical data points. A good dashboard helps both technical and non-technical users understand and interpret business intelligence to make more informed business decisions. They can actively participate in the analytics process by compiling data, visualizing trends or occurrences, and uncovering an objective view of performance metrics that can be immediately understood.
As BI has become a priority in the past decade, analytics solutions increasingly support newer options to visualize complex data sets and realize effective data visualization. Today, there are many types of data visualization to show and represent data in a more engaging way, with the exact output dependent on the analytics solution in question.
- Make data easier to understand for all
- Increase accessibility and collaboration on data points
- Create quick overviews of complex numbers
The benefits of using BI dashboards
For many organizations, multiple tools are used to track KPIs and metrics, such as marketing platforms, email platforms, and CRM tools. Monitoring and analyzing the data from each tool individually takes a lot of time and effort to compile. It's often disjointed and hard to put together, too.
The solution? A data visualization dashboard with a graphical representation of your data.
Dashboards are used for data visualization so that users can glimpse a bird's eye view of the data from each of their business platforms in one centralized location, gaining the ability to understand what it means for the business quickly. Businesses can also drill down deeper into any aspect of the data with a few clicks. This is great for specific departments to compare year-over KPIs, projections, and more.
Who is Analytics Dashboards and Data Visualization for?

Analytics dashboards and data visualization can be helpful in many different industries and uses. Many in these fields utilize data visualization for business operations and data-driven decision-making:
- Financial services
- Healthcare
- Life sciences
- Manufacturing
- Media and communications
- Public and social impact
- Retail and consumer goods
- Technology
- Transportation
- Education
- And more
Whether it's a sales department manager in a media company wanting to make their quarterly KPI report more engaging for executives or a C-suite in finance using visualizations to represent their total investments, data visualization is equally essential.
How Do I Get Started With a Data Visualization Consultation?
Getting started is fast and easy with the experts at WCI.
- Start with a Free On-site Discovery Session — During the discovery session, you will meet with a senior data analytics consultant from WCI and share your data challenges and goals with us.
- Next, we Review the Proposed Solutions — After the session, we'll summarize, evaluate, and provide a list of data management solutions and a project outline custom to you.
- After that, we start the Solution Development Process — After the agreement is signed, WCI and your team work together to develop the right solution that meets your project goals and supports your business.
- Lastly, we move into Training and Support — This is a key stage of our solution and crucial to your data.
Is your business leveraging data to its fullest potential?

Find out by spending half a day with someone who knows data management and can help you answer this question.
At WCI, our data visualization consultants help businesses organize, optimize, and analyze their business data in ways that help them make informed and profitable data-driven decisions. We help you tie together business data from your entire company to better inform and discover opportunities.

