In today’s increasingly data-driven world, it’s more important than ever to have accessible ways to view and understand data and leverage it to make informed business decisions. Business analytics and data visualization provide insights into how things have historically played out, possibilities for new scenarios, and much more. 

It’s no surprise businesses today have gravitated toward wanting to understand and leverage data visualization capabilities as an efficient way to help make sense of business-critical information and large sets of complex data at scale. Across all industries, business leaders today understand the importance of data and how to use it to its fullest potential – with the help of analytic dashboards and data visualization tools

In this post, we’re breaking down analytics dashboards, data visualization, what each is, their advantages, and how they can impact your business in significant ways. Let’s dive in!

Why is data visualization important?

Business intelligence aims to collect and turn data into actionable information that fulfills operational and strategic objectives and supports a person’s decision-making. Why is it important? Because it helps people see, interact with, and better understand their organization’s data. Whether simple or complex, effective visualization and BI tools can bring everyone together on the same page, regardless of their expertise with data or daily interaction with these numbers. 

Not only is the actual data necessary, but the ways BI display them are just as crucial. According to MIT, 90% of information transmitted to the brain is visual. This means that the better we can represent complex numbers like big data, the easier it becomes for all stakeholders and employees to understand. Data visualization ultimately helps provide more people who use BI tools and analytics solutions with a familiar, engaging, interactive way to absorb information at a glance and understand the insights hidden beneath the numbers.

These data visualization tools and processes provide a quick and effective way to communicate and share information in an easy-to-read manner using visual information. 

See data visualization services offered by WCI >>>

What is a data visualization dashboard?
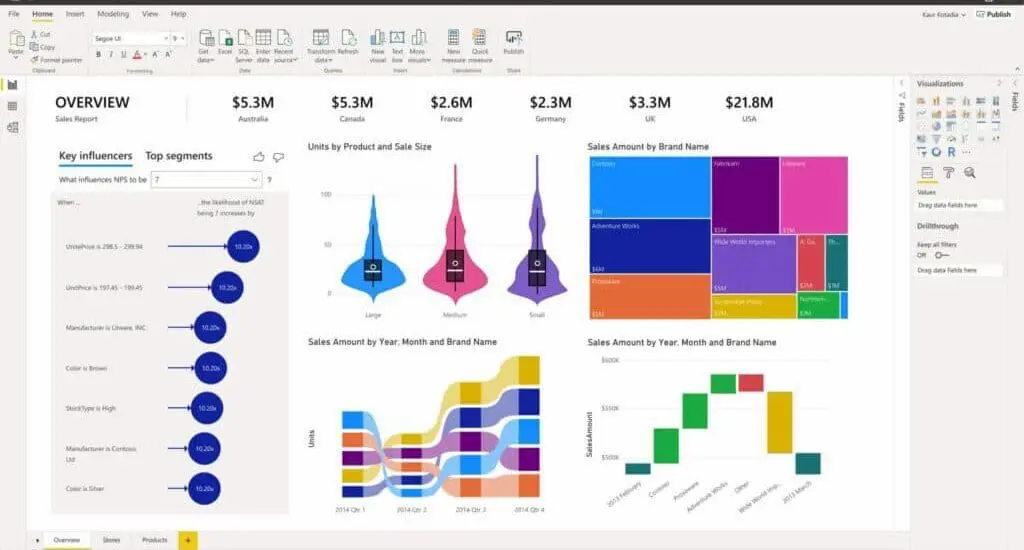
What Is A Data Visualization Dashboard | Power Bi Dashboard Example
Power BI Dashboard Example

Data visualization, also known as data exploration or Business Intelligence (BI), is often referred to as dashboarding. The data visualization industry has garnered much attention over recent years because of the easy-to-understand format in which complex data is delivered. Dashboards, in turn, present this complex data in an easy-to-interpret format. 

These dashboards allow those viewing them to easily track, analyze, and display KPIs, metrics, and critical data points. A good dashboard helps both technical and non-technical users understand and interpret business intelligence to make more informed business decisions. They can actively participate in the analytics process by compiling data, visualizing trends or occurrences, and uncovering an objective view of performance metrics that can be immediately understood.

As BI has become a priority in the past decade, analytics solutions increasingly support newer options to visualize complex data sets and realize effective data visualization. Today, there are many types of data visualization to show and represent data in a more engaging way, with the exact output dependent on the analytics solution in question. 

  • Make data easier to understand for all
  • Increase accessibility and collaboration on data points
  • Create quick overviews of complex numbers

The benefits of using BI dashboards

For many organizations, multiple tools are used to track KPIs and metrics, such as marketing platforms, email platforms, and CRM tools. Monitoring and analyzing the data from each tool individually takes a lot of time and effort to compile. It’s often disjointed and hard to put together, too. 

The solution? A data visualization dashboard with a graphical representation of your data. 

Dashboards are used for data visualization so that users can glimpse a bird’s eye view of the data from each of their business platforms in one centralized location, gaining the ability to understand what it means for the business quickly. Businesses can also drill down deeper into any aspect of the data with a few clicks. This is great for specific departments to compare year-over KPIs, projections, and more. 

Who is Analytics Dashboards and Data Visualization for?

Analytics dashboards and data visualization can be helpful in many different industries and uses. Many in these fields utilize data visualization for business operations and data-driven decision-making: 

  • Financial services 
  • Healthcare
  • Life sciences
  • Manufacturing 
  • Media and communications
  • Public and social impact 
  • Retail and consumer goods
  • Technology 
  • Transportation 
  • Education
  • And more

Whether it’s a sales department manager in a media company wanting to make their quarterly KPI report more engaging for executives or a C-suite in finance using visualizations to represent their total investments, data visualization is equally essential.

How Do I Get Started With a Data Visualization Consultation?

Getting started is fast and easy with the experts at WCI. 

  1. Start with a Free On-site Discovery Session — During the discovery session, you will meet with a senior data analytics consultant from WCI and share your data challenges and goals with us.
  2. Next, we Review the Proposed Solutions — After the session, we’ll summarize, evaluate, and provide a list of data management solutions and a project outline custom to you.
  3. After that, we start the Solution Development Process — After the agreement is signed, WCI and your team work together to develop the right solution that meets your project goals and supports your business. 
  4. Lastly, we move into Training and Support — This is a key stage of our solution and crucial to your data. 

Is your business leveraging data to its fullest potential?

Find out by spending half a day with someone who knows data and can help you answer this question. 

At WCI, our data visualization consultants help businesses organize, optimize, and analyze their business data in ways that help them make informed and profitable data-driven decisions. We help you tie together business data from your entire company to better inform and discover opportunities. 

Start your data visualization journey today with WCI

With an ever-increasing amount of data available at our fingertips, knowing what information is relevant to problems you need to solve or decisions you need to make can be challenging. But with the help of business intelligence software platforms, the data noise can be calmed, and you can gain clarity in what you’re looking at. 

Business intelligence software platforms are designed to make sense of vast volumes of data and offer insights into ways to leverage this knowledge. Business intelligence can help create something meaningful from all that nondescript data when used correctly. BI solutions assemble all the discrete data for analysis and then group and shape them for any business’s use. 

How do you know which BI software platform is right for your needs? Learn more about the top 3 BI platforms and what makes each unique. 

What exactly is business intelligence software?

Business intelligence (BI) is a set of business analytics solutions companies use to retrieve, analyze, and transform data into meaningful business insights. These reports are often compiled into easy-to-read visualization such as charts, graphs, and real-time dashboards. 

BI tools often include data visualization, data warehouses, interactive dashboards, and reporting tools. These BI solutions pull internal data that a business produces into an analytics platform, allowing for deep insights into how different parts of the company affect one another.

So what options do you have to choose from for BI software? AWS, Azure, and Power BI are hands down the three most popular. 

AWS

Aws Business Intelligence Software

AWS (Amazing Web Services) allows application providers and vendors to securely and quickly host applications. You can use AWS or well-documented web services APIs to access AWS’s application hosting platform features and tools.

AWS also provides servers, networking, storage, remote computing, email, mobile development, and security for its users. 

Features and Benefits

  • Easy-To-Use – AWS allows application providers, ISVs, and vendors to quickly and securely host any applications. 
  • Flexible – AWS enables users to select the operating system, web application platform, programming language, database, and other needed services according to their business. 
  • Cost-Effective – You only pay for the computing storage, power, and other resources you need, with no long-term contracts or commitments.
  • Reliable – Take advantage of a scalable, reliable, and secure global computing infrastructure when using AWS. 
  • Scalable and high-performance – Applications can scale up or down based on demand using AWS tools, Auto Scaling, and Elastic Load Balancing.  
  • Secure – AWS’s end-to-end approach securely protects infrastructure, including physical, operational, and software measures, in one single source. 

Who should use AWS

Because AWS’s pricing is modified based on a customer’s usage, start-ups and small businesses often choose AWS and can see the benefits of using AWS for their immediate computing needs. For existing companies, Amazon provides low-cost migration services so your existing infrastructure can seamlessly move over to AWS. As a company grows, AWS also provides resources to aid in expansion. 

Azure

Azure Business Intelligence Software

Microsoft Azure, along with AWS, is one of the top Infrastructure as Services (IaaS) providers, also known as “the Cloud.” Formerly known as Windows Azure, is Microsoft’s public cloud computing platform. It provides a broad range of cloud services, including computing, analytics, storage, and networking.

Microsoft Azure has over 200 applications that offer over 1,000 technical capabilities in the past year alone. All applications are designed to serve businesses from the cloud or over the internet. Companies can offload resources to Microsoft Azure rather than storing and managing data on their own. Azure also helps businesses process data on their computers and servers.

Features and Benefits

  • Speed: Microsoft Azure’s speed is a top benefit, and it emphasizes placing data centers worldwide, giving users the best chance of getting their data when they need it.
  • Automated solutions: Microsoft has developed some of the most fully-automated solutions that can change when needed, without notice required. 
  • Robust templates: Microsoft also provides pre-built tools, such as templates and best practice guides, so you don’t have to create anything from scratch, resulting in a quicker time to market. 
  • Enhanced flexibility: Azure offers immense flexibility with its simplified scalability.
  • Flexible service levels: Because companies pay for only what they use, there’s a sense of freedom for companies to move between tiers and maximize budgets. 

Who should use Azure

Azure is a fast, flexible, and affordable platform, and its pricing and capabilities make it a significant public cloud offering on the market. Companies needing a deep and wide tool interplay with many other services should consider Azure as their BI software. 

Power BI (Microsoft Power BI)

Microsoft Power Bi Business Intelligence Software

Power BI is a collection of software services, connectors, and apps that combine to turn a business’s unrelated data sources into coherent, visually immersive, and interactive insights. 

Features and Benefits

  • Data visualization – Power BI offers a variety of easy-to-read and interpret visualizations, including charts, graphs, dashboards, and more. 
  • Machine-learning pattern predictions – Allow Power BI to harness your data’s power and provide future projections based on trends. 
  • Great for complex, large data – Power BI is an excellent option for businesses working with vast amounts of complex data. 
  • Easy creation of reports and dashboards – You don’t need to create custom dashboards unless you want to because many pre-built options are accessible. 

Who should use Power BI

Power BI is an excellent option for those wanting data visualizations. This software is especially relevant for those in the following industries: software or IT companies, the hospitality industry, the financial industry, management consulting services, retail sectors, staffing & recruitment industry.

Finding the right business intelligence solutions

In the race between top cloud providers, it will be exciting to see what new initiatives these three providers embrace in the future. If you’re ready to get started or have more questions about BI or finding the right business intelligence software platform, WCI Consulting is here to help. Contact our team today to get started with your training. 

A successful data strategy transforms a company’s data into informative insights and financial gains — but it shouldn’t stop with simple reports and charts. Instead, your data should help you look far beyond what’s happening in your business and better plan for the future ahead. With this data at your fingertips and a well-laid data strategy, the possibilities are endless. 

Harness your data and develop a sound strategy that supports your organizational growth and boosts your bottom line. Suppose you want to become data-enabled, start a data-driven transformation program, or grow your organization using data insights. In that case, a comprehensive data strategy is a fundamental must-have for your organization. 

Whether you are already implementing a big data strategy or just starting, these four components are crucial in creating a successful enterprise data strategy that works for your company’s unique needs. 

Things to Change About Your Data Strategy

1. The Purpose of Your Strategy

Before you can use a data strategy, you must first determine the purpose of why you have it in place. How do you want to leverage your data and use it to inform business decisions? It’s essential to identify what it is you want to use data to do. Without a clear strategy, your data won’t inform your plans and decisions within the business.

There is no reason to create a new database for storing data if you haven’t already established how to leverage that data and allow it to inform your decisions. Data uses are numerous, from reporting output numbers and funders to feeding data-driven algorithms that speed up your work and persuade people to join your cause. 

If you’re at the beginning of your data journey or are considering a new strategy at your organization, it may be an excellent time to assess what outcomes you want to achieve with data.

2. Your Data Management Processes and Practices

Data management is a crucial business driver that helps ensure data is gathered, validated, stored, and protected in a standardized, repeatable way. It is essential to develop and deploy the right processes to manage your data so end users are confident that their information is reliable, accessible, and up to date.

You can easily collect data, but managing, organizing, and utilizing that data can make or break the bottom line. If you’re unsure how to process your data, work with a data management consultant who can help your complicated data system adhere to your business objectives and improve your bottom line.

3. Your Approach to Data Governance

Data in today’s day and age is used for everything, and data governance functions, processes, and technologies should be constantly revisited. As you review your data, consider managing data quality, metadata, cataloging, self-service data access, security, and compliance across your enterprise-wide data and analytics lifecycle. Further, extend data governance to foster trust in your data by creating transparency, eliminating bias, and ensuring explainability for data and insights fueled by machine learning and AI.

With mergers, changes in data governance, executive restructuring, new regulations, emerging competitors, and other shifts in the business environment, a flexible approach to enterprise cloud data strategy tailored to your needs is the best option for many businesses. 

Working with WCI Data Solutions ensures long-term business success

WCI Data Solutions supports partners in finding long-term business success when it comes to data management in a variety of ways. We support businesses with the following: 

  • Exploring the current systems through an audit of how your business consumes and uses data
  • Mapping out an Enterprise Data Strategy that caters to the data needs and goals of the organization
  • Building and executing a Roadmap that achieves these strategic initiatives
  • Assuring long-term success by providing post-project support

4. How You Manage Change in Your Strategy

No strategy is ever complete without an element of change management clearly outlined. Adapting your culture to be more holistic and getting stakeholders to work together and formulate the business questions for your data to answer is not easy. Consider how you’ll manage this change in your organization. 

Remember that any effective data strategy aims to tie together the various components of your business data and better inform and discover marketing opportunities through these numbers. Whatever strategy makes the most sense for your organization, embrace it and pivot as you need.

And for all of the other questions you have, an experienced data consulting partner can help.

Need Help Developing A Successful Data Strategy? 

The team at WCI Consulting lives and breathes data. Discover the best ways to manage your data, schedule your free, on-site discovery session with our experts, and spend half a day with people who know data inside and out.

As a business leader, you may understand that data management and business intelligence are essential to your organization’s success. Business analytics enable you to make informed, fast decisions, react to market changes efficiently, and always stay one step ahead of the competition. Companies that successfully implemented master data management continually grow, but how can you ensure that your business’s intelligence is optimized and working for what you need?

If you’re looking to tie together business data from all areas of your company to inform and discover opportunities but aren’t sure how, we’ve got the answer for you.

So What Does Business Intelligence (BI) Include?

Business intelligence refers to the technology that enables businesses to organize, analyze, and contextualize their organization’s data from all aspects of the company in one single source. BI includes multiple tools and techniques that help transform raw data into meaningful and actionable information.

How Is BI Used?

When used correctly, BI can be leveraged by many different organizational departments. For example, sales, marketing, finance, and operations departments can harness business intelligence to help guide their strategies.

For example, various teams and departments may use business intelligence for the following:

  • Data scientists and analysts: Analysts are usually very familiar with BI and use the centralized data to understand where opportunities for improvement exist and what strategic recommendations should be made to company leadership.
  • Finance: Finance departments can blend financial data with operations, marketing, and sales reporting to offer insights into which decisions make the most sense regarding profit and loss.
  • Marketing: BI can help marketers track campaign metrics and efforts from one centralized place. These systems also offer real-time tracking, measure each effort’s performance, and allow marketers to better plan for future campaigns.
  • Sales: Sales data analysts and operation managers often use BI dashboards and key performance indicators (KPIs) to quickly access complex information like discount analysis, customer profitability, and customer lifetime value.

Explore three easy ways your business can start maximizing business analytics, data management, and business intelligence for ongoing success.

1. Evaluate your data management and business intelligence ecosystem

To create a path towards success, you first need to evaluate where you currently stand. Identify how your business uses analytics to drive decisions and communicate across departments. Your marketing, sales, customer service, and other teams are all probably using data analytics in one way or another. Ask yourself if these departments are siloed or collaborative in data management and sharing.

And if you’re not using data at all but seem to be succeeding, the wave you’re riding will only last so long. Without data to drive your decisions, strategy, and path forward, you’re taking shots in the dark and guessing what will work.

As you evaluate your team and how they’re using BI currently, try to keep the following questions in mind:

  • What’s your BI vision, and do you have any? How is that vision aligned with your IT and corporate strategy?
  • Who are your BI players, and how coordinated are they? Is there function overlap?
  • How do you handle data management and data governance? How do you support BI users?
  • What factors do you use to make business decisions?

As you uncover answers about your current business processes and how your team utilizes them across departments, you should see where improvements can be made in areas that cause frustration or hold-ups.

2. Create a strategy

Deliver actionable business insights by creating a business-aligned reporting and analytics strategy. Well-designed data management processes can help your business benefit from productivity improvements, cost efficiencies, and a flexible ability to respond quickly to changing needs.

When your data is well organized and managed, you can reduce data movement, uncover performance breakdowns, and better empower your users to access the information they need in one simple click. In addition, with data management in place, companies like yours can avoid unnecessary duplications, and employees won’t conduct the same research or fulfill the same tasks repeatedly.

A company’s success depends heavily on its ability to make the right decisions quickly. If it takes too long to react to market shifts or activities of competitors, businesses are likely to lose money, miss opportunities, and fall behind the competition. The solution is in organized data, allowing decision-makers to acquire vital information faster and respond appropriately.

3. Emphasize the big picture to employees

It’s essential to train your employees to think critically and make decisions quickly. While all businesses rely on their employees to make critical decisions, in today’s fast-paced economy, it is more important than ever.

The ability to think critically involves analyzing information, interpreting its meaning, and identifying key issues. It also requires seeing both sides of an issue and evaluating the implications that different decisions can create. The ability to make quick decisions depends on how employees can weigh out the pros and cons of various options quickly and efficiently. When employees do learn these skills, businesses gain a competitive edge.

Moreover, they can help ensure that their employees are better equipped to handle the challenges of the modern workplace.

Start achieving success through data management and business intelligence today.

If you’re ready to provide real-time insights and solutions to your team, WCI Consulting can help you make that happen. Learn more about our business intelligence consulting services and how they can help grow and support your business.

WCI Consulting Presents…The Most Common Questions in Business Intelligence

We sourced our support archives and pulled some of the most common questions we get from our clients. In this three part webinar series, we answer questions that can apply to any Business Intelligence user.

The topics covered include: security, data servicesdashboards, and more!

Watch now to discover how to be a better BI user and improve you Business Intelligence knowledge.

The Most Common Questions in Business Intelligence – Part 3

The final part of the 3 Part webinar series covers:

  • Web Intelligence
  • Conditionals
  • Alerters
  • Drilling
  • Drill – Down
  • Linking
  • Input Controls

The Most Common Questions in Business Intelligence – Part 2

The 2nd part of the 3 Part webinar series covers:

  • Controlling query row and execution times using Information Designer Tool, Universe Designer Tool, and Web Intelligence
  • The purpose of implementing these controls to ensure stability in the BO environment

The Most Common Questions in Business Intelligence – Part 1

The 1st part of this 3 Part webinar series covers:

  • Managing, sorting and ‘if’ statements in SAP Web Intelligence
  • Creating prompts in the Information Design Tool
  • Importing and viewing data via Query as a Web Service in Dashboard Designer

Watch as WCI reviews general topics including Promotion Management and how to handle user security in the Launchpad for SAP BusinessObjects 4.1. Learn about what else is new in the 4.1 upgrade: watch videos.

Thinking about an upgrade for your current SAP Business Objects environment?

Don’t commit without first getting a free BOBJ upgrade assessment from WCI!

Video Guide: Creating a Map in Power BI from Excel Data

Watch this Microsoft Power BI map tutorial to find out how to take data from Microsoft Excel and map it in Power BI.

If you have any further questions about Power BI or other business intelligence tools, contact us below to discuss how we can help.

WCI Data Solutions Named Advanced Partner in the Amazon Web Services (AWS) Partner Network (APN)

WCI Data Solutions has met demanding certification prerequisites on technical and business levels to get Advanced Consulting Partner status in the Amazon Web Services (AWS) Partner Network (APN). Focusing on providing services related to strategy, migration and management of data, this continuing relationship with AWS is a testament to WCI’s commitment to innovation in a world that has embraced moving their data into the cloud.

PLANO, TEXAS (PRWEB) APRIL 14, 2018

WCI Data Solutions, a leader in data management and data strategy consulting, is pleased to be named Advanced Consulting Partner for the Amazon Web Services (AWS) Partner Network (APN). This exclusive tier of partnership is reserved for AWS partners with significant technical knowledge of the AWS platform. To qualify for this tier, partners must demonstrate their technical capabilities in the AWS ecosystem and provide comprehensive references for their competences.

“We are excited to be a part of the Advanced tier in the Amazon Partner Network as we can see that cloud services are exactly what our market is trending towards,” explains Marty Carney, CEO of WCI. “We know that our reputation amongst clients is that we are the go-to for all things data and innovation, so as the market moves their data to the cloud, we want to be able to showcase our demonstrated abilities and maximize value for our clients.”

As an Advanced Partner in the APN, WCI Data Solutions provides clients with help in designing, architecting, building, migrating and managing their data and applications on the AWS cloud platform. This enables customers to focus on their business first and depend on WCI for the certified and assured technical expertise regarding AWS tools. With this new level of certification, WCI has gained access to further resources and training to support thorough analysis of a company’s current state of data management, cloud transition planning and AWS services management.

“At the end of last year, AWS announced that the majority of Fortune 500 companies and over 90 percent of Fortune 100 companies utilize APN Partner solutions and services,” said Chris Hagans, COO at WCI. “For us this means that the ability to provide valuable consulting services in AWS is paramount to our clients. AWS is what the market is looking for and WCI is certifiably proud to offer our skills. My team worked hard to get the Advanced Certification and we’re excited to see how AWS helps our clients.”

WCI has worked with clients in various industries that are continuously requesting pathways for cloud transitions due to the cost savings and ease of scalability that AWS offers. “AWS is the best fit for any business because it scales to only what you need and can be adjusted quickly as a business grows. AWS has allowed our clients to attain their data management goals, while saving money on infrastructure.” describes Hagans.

About WCI Data Solutions: 
Headquartered in Dallas, Texas, WCI Data Solutions has focused on providing clients with industry-leading data strategy since 1998. Their services apply the most effective and appropriate solutions to help organizations turn data into valuable business information. WCI also specializes in seeing through convoluted systems to make sense of data in a way that’s best for the clients’ business needs. By focusing on the leading vendors in data analytics, business intelligence and data management WCI ensures that the clients’ business has access to the right plan to achieve the results that they want.

http://www.prweb.com/releases/2018/04/prweb15407709.htm